TEKS 4.9A · Grade 4
Showing data on dot plots, tables and stem-and-leaf plots
Putting a list of numbers into a chart, and checking a chart against the list it came from, without losing any of them.
The standard itself reads: “4.9A: represent data on a frequency table, dot plot, or stem-and-leaf plot marked with whole numbers and fractions”
One of them, worked all the way through
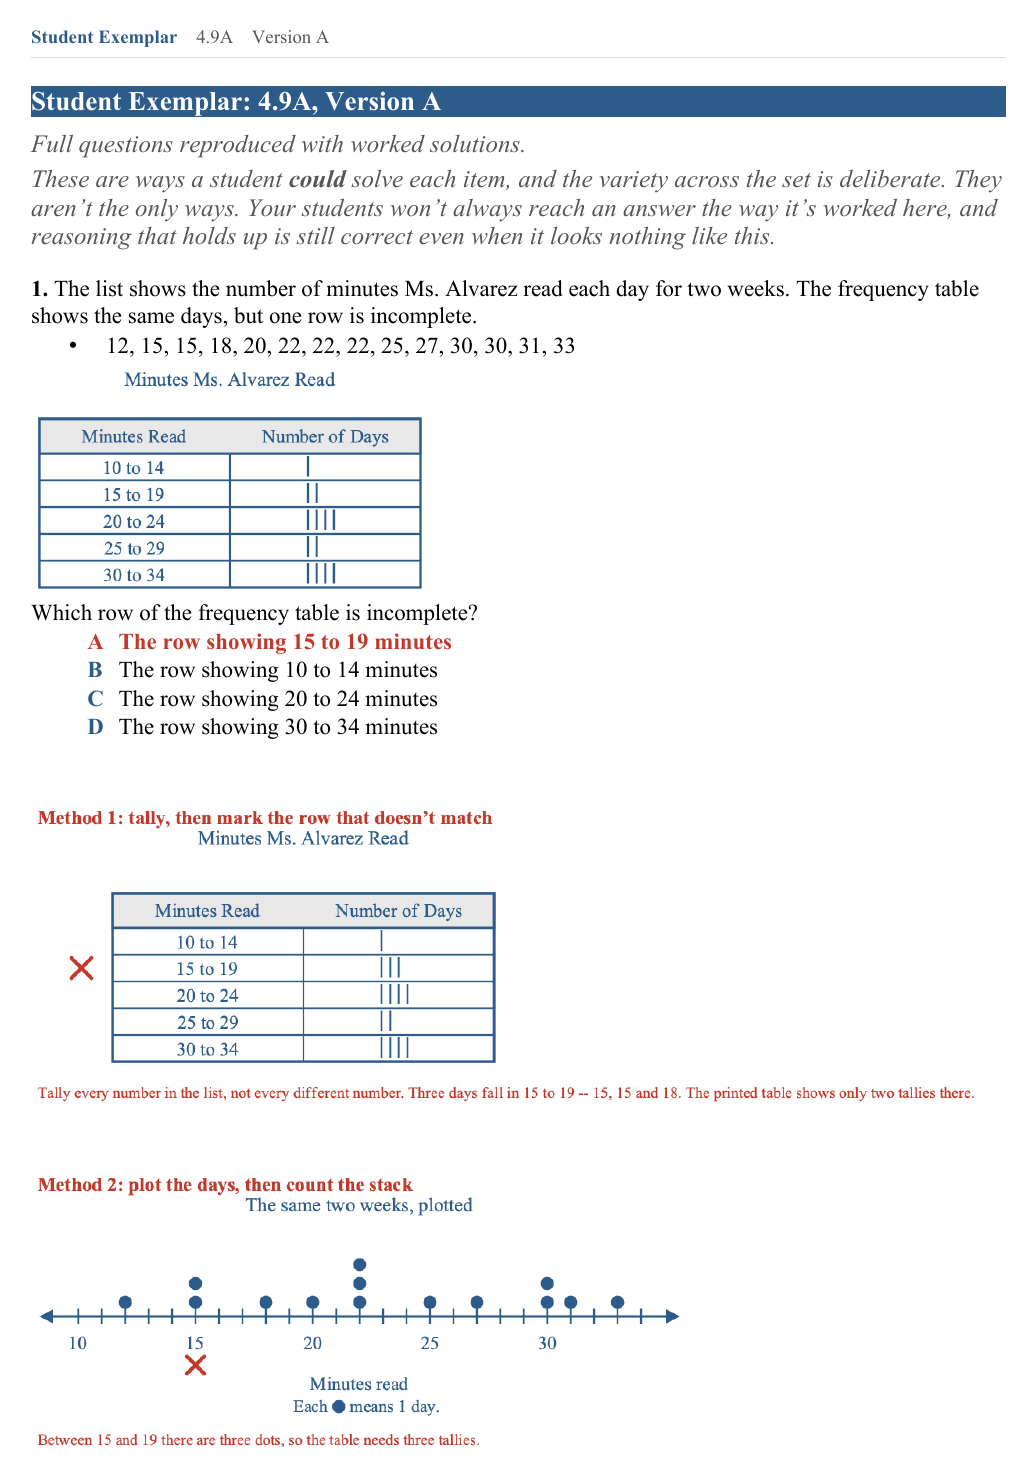
- Go through the list in order and put one tally down for every number.
- A number that turns up twice gets two tallies, not one.
- Compare the counts with the table. The 15 to 19 row is one short.
This is one way, not the only way. The printable shows the same question worked more than one way, because children get there differently.
What usually goes wrong, and what helps
Each of these is a different misunderstanding rather than a slip, so each one needs something different. Find the one that sounds like your kid.
- The student plots one dot for each different number instead of one for each number in the list
- Every number in the list gets its own mark, even a repeat. Cross each one off the list as it is counted.
- The student reads a stem-and-leaf plot without reading its key first
- Read the key first. It tells you whether a row means 2 and 7 or twenty-seven.
- The student counts how many categories there are instead of how many values are in them
- Ask “how many days?” rather than “how many rows?”
Try this at home
Give them a short list with a repeat in it, 5, 7, 7, 8, and ask them to plot it. One dot per NUMBER, not one dot per different number, is the thing that trips almost everyone.
where these methods come from The strategies behind it: the Data and graphs chart.
What’s in the printable
Four questions on this skill, two to a page. The rest of the file is for the adult: an answer key, a worked solution for every question, and teacher pages on what each wrong answer means. 10 pages in all.